Publish Spark Streaming System and Application Metrics From AWS EMR to Datadog - Part 3
This post is the third in the series to get an AWS EMR cluster, running spark streaming application, ready for deploying in the production environment by enabling monitoring.
In the first part in this series we looked at how to enable EMR specific metrics to be published to Datadog service.
In the second post, I explained how to install Datadog agent, then configure it on each node of a Spark cluster automatically either at the time of cluster launch, or when auto-scaling up the cluster on the AWS EMR service. This enables Datadog agent to periodically execute spark check that publishes spark driver, executor and rdd metrics which can be plotted on Datadog dashboard.
In my view, the most important metrics are the ones that give you an insight into how your particular application is responding to events. Some useful measures are:
At a high level, answers to the above questions are available on the Spark UI.
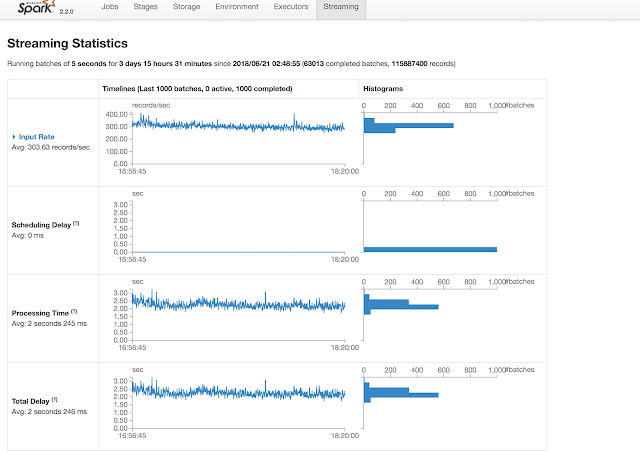

However, as the application developer, you have the best picture of your application's function, its business logic, and its downstream dependencies, whether it be a database, an API server, or a message bus. Therefore, you have the best idea of what metrics will be useful to monitor the health and performance of your spark streaming application.
Once you have figured out the list of application metrics, the implementation is quite straightforward. If you already have a spark cluster with the Datadog agent running on the master and executor nodes described in the second post, all that is left is to implement code to:

In the first part in this series we looked at how to enable EMR specific metrics to be published to Datadog service.
In the second post, I explained how to install Datadog agent, then configure it on each node of a Spark cluster automatically either at the time of cluster launch, or when auto-scaling up the cluster on the AWS EMR service. This enables Datadog agent to periodically execute spark check that publishes spark driver, executor and rdd metrics which can be plotted on Datadog dashboard.
In my view, the most important metrics are the ones that give you an insight into how your particular application is responding to events. Some useful measures are:
- How often are you receiving events?
- Are their peaks and troughs?
- Is your spark streaming application able to process the events within the specified batch interval.
- Are the downstream dependencies able to keep pace?
- Were there errors, retries, failures during event processing?
- Does your application demand lots of memory, is it compute intensive or does it demand lots of storage?
At a high level, answers to the above questions are available on the Spark UI.


However, as the application developer, you have the best picture of your application's function, its business logic, and its downstream dependencies, whether it be a database, an API server, or a message bus. Therefore, you have the best idea of what metrics will be useful to monitor the health and performance of your spark streaming application.
Once you have figured out the list of application metrics, the implementation is quite straightforward. If you already have a spark cluster with the Datadog agent running on the master and executor nodes described in the second post, all that is left is to implement code to:
- Launch a reporter thread in the initialization phase of your spark streaming application, and
- Publish metrics as events are processed by the application.
Couple of open source library options available:
If all goes well, the published application metrics should become available in Datadog in few minutes of setting this up.
The next step is to create a beautiful data dog dashboard of combined EMR, Spark, and application metrics to give you visibility into the health of your Spark Streaming application.

Finally, you want to create monitors based on these metrics, and integrate with alerting services like Pagerduty to ensure 24X7 availability of your real time spark streaming application.
Summary
As I wrap up this series of posts detailing how to publish Spark Streaming System and Application Metrics deployed on AWS EMR cluster to Datadog, let's summarize the steps:- Enable Datadog integration with AWS Elastic Mapreduce Service.
- Bootstrap EMR cluster launch with script to install Datadog agent, and configure spark check.
- Setup spark streaming application to publish metrics relevant to data ingestion and processing.


Comments
Post a Comment