Publish Spark Streaming System and Application Metrics From AWS EMR to Datadog - Part 1
I recently implemented a spark streaming application that consumes from multiple kafka topics different types of telemetry events generated by mobile devices. I set up the spark streaming cluster using AWS EMR service, and eventually succeeded in running the application on this cluster. So far so good.. 👏
The next important milestone in my project was to get my cluster and application ready for deploying in the production environment. I wanted to ensure that I could monitor the different components, understand performance parameters, get alerted when things go wrong.
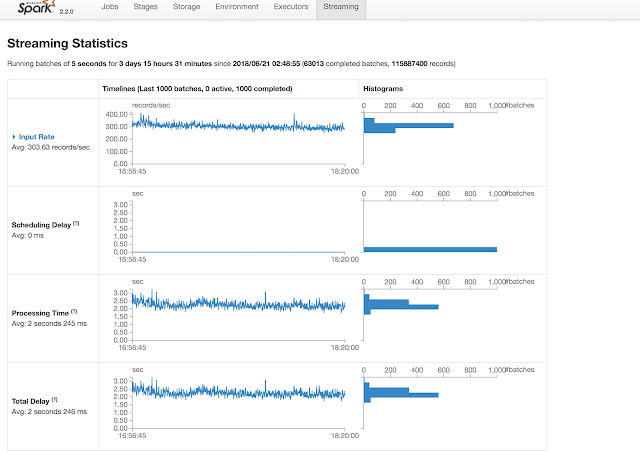
The Spark UI provides a pretty good dashboard to understand useful information about the health of the running application. However, this tool provides only one angle of the information necessary for understanding your application's statistics in production environment. While metrics generated by AWS EMR service are automatically collected and pushed to AWS CloudWatch service, these are more focused towards running MapReduce tasks on the YARN cluster, therefore only some metrics apply to the spark streaming use case. Moreover, we use Datadog service for application and cluster monitoring.
The intent of this series is to document the different ways of aggregating relevant metrics in datadog for a spark streaming application running on YARN cluster in AWS EMR.
Luckily, Datadog has already enabled integration with AWS EMR and Spark. For a quick intro, read this
Datadog Integration with AWS EMR
This one is pretty straightforward. All the steps and metrics you can graph are documented nicely here. Just make sure your datadog account is linked to your relevant AWS account, and has permission to pull metrics. Couple of screenshots to help here:
Select Amazon EMR tile if not already in Installed state.

Fill in the AWS account details in the Configuration tab, and select ElasticMapReduce in the left navigation bar.

Ensure the AWS Role specified in the configuration has List* and Describe* permissions for ElasticMapReduce

Once the above integration is successful, and assuming you have a running EMR cluster with some tags as shown in below screenshot,

Your cluster's elasticmapreduce metrics should become available in datadog in few minutes of setting this up.

Now it's time to explore how we can enable publishing spark driver, executor and rdd metrics about our running spark streaming app in EMR Yarn cluster. You can read more about this datadog feature.
In the next part in this series, I will show you how to set up your EMR cluster to enable spark check.
If you have questions or suggestions, please leave a comment below.
If you have questions or suggestions, please leave a comment below.

Comments
Post a Comment