Publish Spark Streaming System and Application Metrics From AWS EMR to Datadog - Part 3

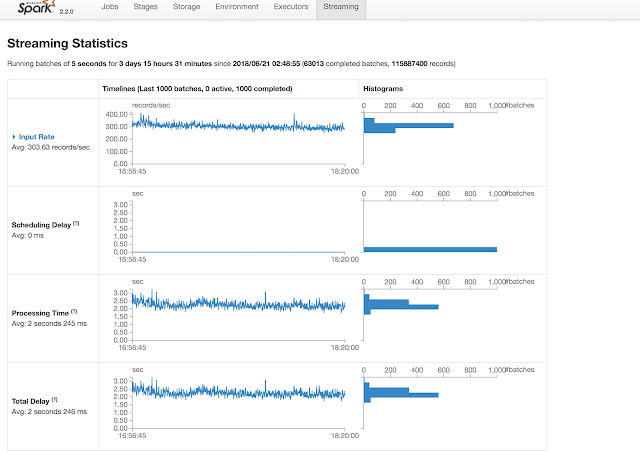
This post is the third in the series to get an AWS EMR cluster, running spark streaming application, ready for deploying in the production environment by enabling monitoring. In the first part in this series we looked at how to enable EMR specific metrics to be published to Datadog service. In the second post , I explained how to install Datadog agent, then configure it on each node of a Spark cluster automatically either at the time of cluster launch, or when auto-scaling up the cluster on the AWS EMR service. This enables Datadog agent to periodically execute spark check that publishes spark driver, executor and rdd metrics which can be plotted on Datadog dashboard. In my view, the most important metrics are the ones that give you an insight into how your particular application is responding to events. Some useful measures are: How often are you receiving events? Are their peaks and troughs? Is your spark streaming application able to process the ev...

